AKS Detector — “Diagnose and Solve Problems” as a custom addon
Introduction
In this article, we’re going to take the AKS Diagnose & Solve Problems Feature (which is only currently available to view via the AKS UI) and create a kubernetes addon, which will expose all this good health information from your AKS clusters via logs & metrics. We can then scrape these metrics using something like Prometheus or Datadog & alert when certain thresholds are exceeded.
Diagnose & Solve Problems
Let’s first look at what Diagnose & solve problems is, & how we access it.
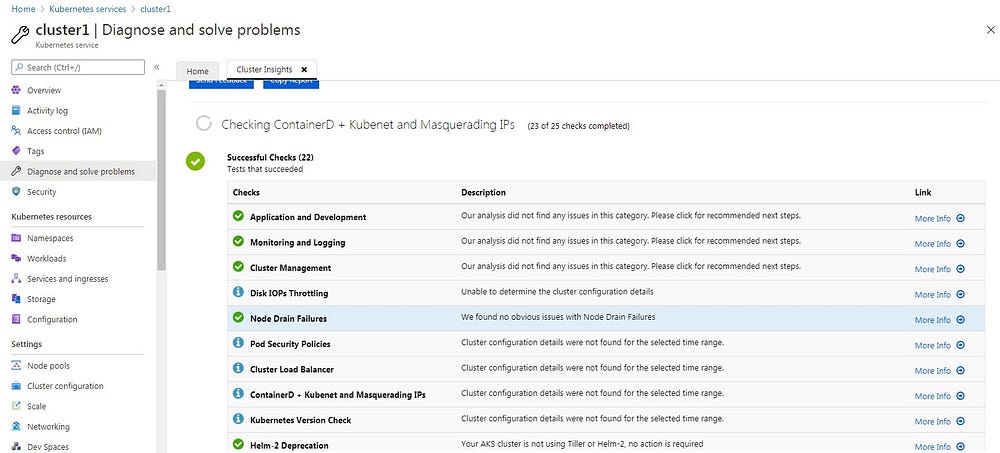
Diagnose & Solve problems is a useful feature (in preview as of writing) within the AKS UI. It gives us a treasure chest of health information about our cluster. This information can include things like possible node drain failures, azure resource request throttling issues etc

Let’s have a quick look at both of the examples above.
Node Drain Failures
This health detector can give us an early warning of possible node drain failures. So let’s say we have an unrealistic Pod Disruption Budget in our cluster, and we perform a cluster upgrade or a nodepool upgrade, then the node drain that’s part of these operations will time out, resulting in a failure. If we were to consult the “Diagnose and solve problems” before we upgraded the cluster, we could have seen the issue, and taken steps to remediate.
Azure Resource Request Throttling
This health detector can inform you that Azure Resource Manager is Throttling requests that are been made from an Identity for the subscription and the tenant. For example, a cluster addon like velero or external dns will perform ARM calls to the subscription. If limits are hit, then throttling can cause 429 error codes. https://docs.microsoft.com/en-us/azure/azure-resource-manager/management/request-limits-and-throttling
Design
Ok Let’s take a look at how we’re going to extract this health information.
Diagnose & Solve Problems API
The following is the API format we will hit for each detector
https://management.azure.com/subscriptions/<subscription id>/resourcegroups/<resource group name>/providers/microsoft.containerservice/managedclusters/<cluster name>/detectors/<detector name>?startTime=YYYY-MM-DD%20HH:MM&endTime=YYYY-MM-DD%20HH:MM&api-version=YYYY-MM-DDThere are currently several detector names (25 at time of writing) available which we can query.
Example: Given a cluster clusterA, in resource group rsgA in a subscription with ID 123. Now let’s say we have a Security Principall which has read access to clusterA, and we generate an access token for this identity.
Now we can use this access token in a curl command to query the api for the detector “node-drain-failures”
curl -X GET -H "Authorization: bearer TOKEN" https://management.azure.com/subscriptions/123/resourcegroups/rsg1/providers/microsoft.containerservice/managedclusters/cluster1/detectors/node-drain-failures?startTime=2021-01-25%2021:59&endTime=2021-01-25%2021:59&api-version=2019-04-01Roles
Our Security Principals (or identities) will need read access to our AKS clustter i.e. Microsoft.ContainerService/managedClusters/read
API Output
The output from the API provides a list of tabular information about items under this detector name. This table of information takes the form of Status, Message, Solutions, Expanded etc
The first interesting piece of information here is the status. The status can be empty, of have strings of “Success”, “Info”, “Warning” and “Critical”. An example of a detector which could potentially give a Critical, is the node-drain-failures. If we had a Pod Disruption Budget misconfiguration in our cluster which could lead to a draining failure, then this detector would give us a critical. We will use this status for our own logging error codes and our metric levels.
The other fields, we will concat and log out with the corresponding error code.
Go App
We want to run our addon in our cluster, so we’re going to go ahead and write a simple Go app for it.
SDK
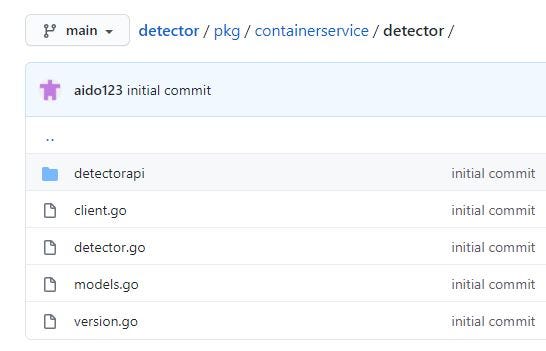
Microsoft Azure doesn’t provide a go sdk api for this detector service, so we’ll first write one, and expose it as a package so others can potentially use it.
github.com/aido123/detector/pkg/containerservice/detector

Logic
The logic is fairly simple. In our main package, we’ll just iterate through each detector, call our new detector package api, extract each piece of tabular data, log it out and expose as a metric.
Logs
We’ll output our logs to std out via Debug (Success or no status), Info (Info status), Warn (Warning status) and Error (Critical status).
Metrics
We’ll expose our metrics via in the prometheus format with the same name as the detector (i.e. node-drain-failures will become detector_node_drain_failures). A Critical will result in a 4, Warning a 3, Info a 2 and Success a 1. If there are several pieces of tabular info for a detector, we will take the higher status as the metrics (i.e. if we have a Success, an Info and a Warning, we will expose that detector metric with a value of 3).
Test
All right! Let’s bring it for a test run.
- Create an Azure Container Registry
az acr create -n reg1009855 -g rsg1 --sku Standard- Create docker image and publish to ACR. I used Azure DevOps Pipelines for this :- https://github.com/aido123/detector/blob/main/azure-pipelines-2.yml (configured via azure devops pipelines to create a connection to push to ACR)
- Create an AKS Cluster — Accept the defaults
- Create an SPN ID and note the ID and Secret. We’ll use this as the addon’s identity. You could also used Pod Identity or an Identity on the underlying VMScaleSet as an alternative.
az ad sp create-for-rbac --name detectorspn --skip-assignment{
  "appId": "a5a32677-xyz",
  "displayName": "detectorspn",
  "name": "http://detectorspn",
  "password": "ABC123",
  "tenant": "TENANT-123"
}
- Create a Custom Role
{
  "Name": "AKS Cluster Read Only",
  "IsCustom": true,
  "Description": "Read Only access to AKS Clusters",
  "Actions": [
    "Microsoft.ContainerService/managedClusters/detectors/read"
 ],
  "NotActions": [],
  "DataActions": [],
  "NotDataActions": [],
  "AssignableScopes": [
    "/subscriptions/SUB-123"
  ]
}az role definition create --role-definition aksread.json
- Assign the SPN ID read access to the cluster
az role assignment create --role "AKS Cluster Read Only" --assignee "a5a32677-xyz"- Enable the ACR Admin User Account
az acr update -n reg1009855 --admin-enabled true- Show the docker credentials for this ACR
az acr credential show -n reg1009855- Create a Docker Secret in the default namespace
kubectl create secret docker-registry regcred --docker-server reg1009855.azurecr.io --docker-username=reg1009855 --docker-password=<secret from above> --docker-email=test@test.com- Create a Deployment Manifest
apiVersion: apps/v1
kind: Deployment
metadata:
  name: detector
  labels:
    app: detector
spec:
  replicas: 1
  selector:
    matchLabels:
      app: detector
  template:
    metadata:
      labels:
        app: detector
    spec:
      imagePullSecrets:
      - name: regcred
      containers:
      - name: detector
        image: reg1009855.azurecr.io/detector:X
        ports:
        - containerPort: 2112
        env:
        - name: AZURE_TENANT_ID
          value: <AZURE_TENANT_ID>
        - name: AZURE_CLIENT_ID
          value: <AZURE_CLIENT_ID>
        - name: AZURE_CLIENT_SECRET
          value: <AZURE_CLIENT_SECRET>
        - name: AZURE_SUBSCRIPTION_ID
          value: <AZURE_SUBSCRIPTION_ID>
        - name: DETECTOR_IDS
          value: node-drain-failures,appdev,aad-issues
        - name: RESOURCE_GROUP
          value: rsg1
        - name: CLUSTER
          value: cluster1
        - name: POLL_DELAY
          value: "1800"
        - name: API_TIMEOUT
value: "60"- Apply the deployment manifest
kubectl apply -f deployment.yamlNow as you can see below, we’ll log out each detector, with it’s associated level along with the descriptive details scraped from the api
kubectl logs detector-655d79d44d-x4fwv{"detectid":"node-drain-failures","level":"debug","msg":"Success We found no obvious issues with Node Drain Failures False null","time":"2021-01-30T14:51:05Z"}{"detectid":"appdev","level":"debug","msg":"Success Our analysis did not find any issues in this category. Please click for recommended next steps. Recommended Documents \u003cmarkdown\u003e\n\n* [Tutorial: Using Azu... False null","time":"2021-01-30T14:51:05Z"}
Next we’ll just exec into the detector pod and curl the metrics that are exposed on port 2112.
We can use a telemetry tools like prometheus or datadog to scrape these metrics and alert on them i.e. if detector_node_drain_failures hits a critical (i.e. 4) threshold
kubectl exec -it detector-c4949d96c-qvsnv -- /bin/sh# curl http://localhost:2112/metrics
# HELP detector_aad_issues Detector metric detector_aad_issues
# TYPE detector_aad_issues gauge
detector_aad_issues 2
# HELP detector_appdev Detector metric detector_appdev
# TYPE detector_appdev gauge
detector_appdev 1
# HELP detector_node_drain_failures Detector metric detector_node_drain_failures
# TYPE detector_node_drain_failures gauge
detector_node_drain_failures 1
# HELP go_gc_duration_seconds A summary of the pause duration of garbage collection cycles.
# TYPE go_gc_duration_seconds summary
go_gc_duration_seconds{quantile="0"} 1.31e-05
go_gc_duration_seconds{quantile="0.25"} 2.0901e-05
...
Challenges
One challenge I’ve noticed with this approach, is that some of these API’s don’t provide real time or even near real time information.
For example, if you were to just now apply an unrealistic Pod Disruption budget (minAvailable set to 2, when the replica count is set to 1 for a deployment), the Node Drain Failure detector will not hit the critical threshold until many hours later (In one case, it was 24 hours later). Perhaps this will be addressed in the future from Microsoft, as this feature is still in preview (at the moment of writing).
Conclusion
I hope this has given you some ideas on how you could use this valuable health information as part of your overall AKS Observability solution. Thanks for reading.
